29/10/10

gremlin e le opzioni from intermarket and more

Preambolo
31 dicembre 2009: fine del regime transitorio in materia di Consulenza Finanziaria Indipendente (CFI), salvo ulteriore proroga. L’istituzione della nuova professione con tanto di Albo è sempre più vicina ma non per questo prossima, vediamo perchè. Malgrado la normativa sia già in avanzato stato di composizione, il regolamento attuativo dei famigerati articoli 18 bis e 18 ter del Testo Unico della Finanza del ’98 è da poco entrato nella seconda fase di consultazione a cui potrebbe seguirne una terza; inoltre manca ancora il regolamento del Ministro dell’Economia e pure l’organismo competente di gestione e vigilanza dell’Albo s’ha ancora da nominare; se si aggiunge che quando tutto sarà finalmente perfezionato verrà indetto un solo esame di ammissione all’anno, allora il quadro risulta perfettamente indefinito: esattamente come banche e Sgr vogliono.
Questi Signori della Finanza Nostrana (SFN) hanno temuto che la loro distribuzione potesse sgretolarsi con fiumane di PF che si convertono alla finanza etica senza padroni portando con sè clienti e patrimoni, ma al momento ritengo che questo scenario non sarà per niente catastrofico in quanto l’industria del risparmio carpìto si è ben organizzata durante tutti questi anni di insabbiamento calcolato, ha compreso come imbrigliare la professione nascente e come confondere ancor più le percezioni dei risparmiatori con interventi pubblicitari mirati. Mi riferisco al fatto che il futuro CFI, avendo l’obbligo per legge ad essere indipendente e quindi senza poter ricevere regalìe dall’industria finanziaria pena la radiazione, fornisce al risparmiatore consigli non viziati da conflitti di interessi mentre i SFN che sostengono di essere indipendenti, non avendo tale obbligo, forniscono comunque una consulenza finalizzata prevalentemente alla vendita di fondi, polizze e strutturati, nel nome del risparmiatore e per conto dei propri interessi. Un CFI, di fronte ad un risparmiatore a bassissima propensione di rischio e senza conoscenze finanziarie, consiglierà titoli di Stato o ETF mentre un SFN “indipendente”, avendo costi di distribuzione del servizio, gli rifilerà sicuramente almeno un fondo obbligazionario: questa è la differenza fra indipendenza etica e indipendenza di maniera.
Chi ha recepito la direttiva Mifid per introdurre anche in Italia la nuova professione del CFI, da una parte sta introducendo un cambiamento importante e dall’altra lo vanifica subdolamente in diversi modi (Tomasi di Lampedusa docet) e quindi la gestione del risparmio continuerà ad essere mantenuta ancora saldamente in mani forti e i CFI, orfani di qualsiasi lobby, prospereranno solo nelle crepe del sistema. Caso eclatante è il Comune di Milano quando nel 2008 ha indetto un bando di gara per “consulenza nella struttura finanziaria passiva” (cioè per sanare le sue ingenti perdite da derivati) rivolto alle banche e con esclusione dei CFI.
D’altra parte il risparmiatore medio, amando la “passività”, è un richiamo irresistibile per i satiri specializzati nel suo lato B che hanno i mezzi per mantenerlo in condizioni di assoluta dipendenza e per impedirgli di considerare consulenze alternative, ad esempio quelle che si ispirano alla finanza etica ovvero nel suo esclusivo interesse. La finanza etica è l’opposto dei bond argentini, Parmalat e Lehman che tutti i SFN hanno venduto “nudi” o nascosti in prodotti strutturati, venduti anche da quelli che oggi si professano “indipendenti”. Suggerimento per le associazioni di categoria: stiliamo una lista di banche e Sgr che si proclamano indipendenti e verifichiamo se hanno mai venduto questi e poi mettiamo alla berlina i responsabili. “Finanza etica” è un concetto facile da trasmettere e far assimilare al risparmiatore, e se il risparmio ha ancora una funzione sociale (Costituzione – art. 47) allora è questo il campo in cui seminare per far crescere la domanda di Consulenza Finanziaria Etica e Indipendente.
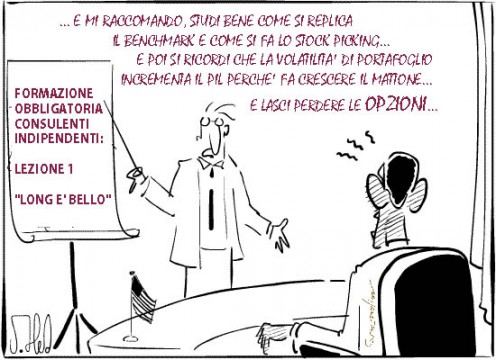
Per stemperare un po’ l’amarezza di queste considerazioni mi sono immaginato una sceneggiata improbabile ma non impossibile, con l’unico obiettivo di compiere un esercizio di ricerca di nuove proposte gestionali che coniughino standard elevati di rendimento alla sicurezza dell’investitore grazie al poliedrico impiego di uno strumento derivato poco noto ai più ma dalle enormi potenzialità qual’è l’opzione il cui “dirompente potenziale autodistruttivo” si manifesta in modo direttamente proporzionale all’incompetenza di chi ne parla in questi termini. Premetto che nella realtà è possibile consigliare portafogli “aggressivi” solo a chi presenta un “profilo di adeguatezza” adatto e per l’inserimento di opzioni anche solo per hedging richiede necessariamente che il cliente sia disposto a seguire il suo investimento e ad imparare a conoscere lo strumento proposto.
Questo che segue è solo l’inizio di un viaggio di esplorazione di portafogli “alternativi” dove le opzioni verranno inserite per fare hedging, concetto spesso ignorato anche da molti CFI, e anche per incrementare il rendimento di un portafoglio “classico”. Non intendo produrre un manuale ma solo un racconto (mi auguro lunghissimo) con tanto di personaggi e il mattatore è il mio eteronimo “gremlin”.
Maurizio B.
Capitolo I – La tela del ragno
“Ehi Grem, quel tizio che avevi già adescato s’è fatto vivo, ha un duecentomila… anni fa dice di aver giocato col fib facendosi del male, comunque è disposto a rischiare ancora un po’… te lo affido ma mi raccomando non strizzarlo troppo”.
E questo che ha parlato era il boss dello studio Consulenza Indipendente Vattelapesca & Associati… avendomi distolto bruscamente dalle mie elucubrazioni opzionistiche non ho potuto altro che bofonchiare con poca convinzione: “Ma tu solo maschi vogliosi di denaro sai portarmi?” già, perchè lui le consulenze al femminile non le molla a nessuno, mica è scemo… “Dài che lo ricevo subito, così smetto di leggere le penose fregnacciate della politica plutobancocratica italo-padana, letali per la salute dei nostri neuroni…”.
Il tizio entra, convenevoli e presentazioni, parte l’interrogatorio per capire quanto lui sa di finanza, cosa vuol fare da grande coi soldi che spera di risparmiare e di avere ancora intatti fra una quindicina d’anni ormai sessantenne, il suo feeling coi FIP (Furti Investimenti Previdenziali) e quanto e come è disposto a rischiare, ecc. ecc. solito  copione mifid ma con più sentimento.
GREM: Senta, caro il mio Illuso Aspirante Risparmiatore nonchè Investitore (d’ora in poi sig. IARI) mettendo la metà dei suoi duecentomila su strumenti oggi considerati tranquilli ma ad altissimo rischio di essere considerati dai posteri come i resti fossili dello Globale e noi degli idioti, e l’altra metà su strumenti fichissimi ma ad altissimo rischio di partorire solo topolini, io potrei presentarle un progetto molto interessante e bello da vedersi. Se poi questo progetto fosse seguito dai risultati attesi, ma di cui ora non se ne ha alcuna certezza, Lei potrebbe raddoppiare nominalmente il capitale fra una ventina d’anni, o anche solo fra quindici o forse fra dieci, e chi lo sa… cosa ne pensa? (Grem sei solo un bastardo quando fai così, perchè non vieni subito al nocciolo delle cose invece di giocare al gatto e al topo?)
IARI: (interdetto e un filo contrariato) Beh, ad essere sincero il suo modo di presentarmi la cosa non mi riempie di entusiasmo, anzi…
GREM: (imperturbabile) Lei per ritenersi minimamente soddisfatto dell’investimento quale rendimento vorrebbe ottenere?
IARI: Mi aspetto di ottenere un rendimento nettamente superiore a quello dei titoli di Stato
GREM: Oggi i nostri titoli di Stato rendono dallo zero al tre percento netto a seconda della scadenza, quelli al tre percento verranno rimborsati a Papi morto… in soldoni, quale rendimento vorrebbe ottenere?
IARI: Diciamo il sette percento…
GREM: (muto, enigmatico, sopracciglio alzato quanto basta…)
IARI: (leggero tic) … comunque non meno del sei… mi hanno detto che siete bravi e se devo pagare una consulenza è ovvio che devo avere migliori risultati del fai da te.
GREM: Sì, Lei ha ragione da vendere e in questo studio c’è gente veramente preparata ma non so se io faccio al caso suo perchè ottenere il sei coi soldi che ha e con un progetto classico, tipo quello di cui Le ho accennato prima, mi sembra un furto… (bastardo incorreggibile, lancia il sasso per vedere l’effetto che fa e nasconde subito la mano)
IARI: In che senso “furto”?
GREM: Intendo furto ai suoi danni… come Lei ha sicuramente intuito nemmeno io sono tanto entusiasta a proporre titoli di Stato, bond di qualità, posizioni rialziste di lungo periodo sull’azionario in tutte le salse e quantaltro che normalmente finisce in un progetto di allocazione e … sbattersi come non mai per poi sperare, sottolineo sperare, di ottenere solo il sei percento su duecentomila… io mi sentirei invece molto più tranquillo a gestire insieme a lei un progetto fuori dagli schemi convenzionali che dia un ritorno di almeno tremilaeuro (questa è bieca manipolazione)
IARI: (interdetto e seccato) Non capisco… il sei percento di duecentomila è tremila e Lei mi offre una cosa diversa che ancora non conosco ma che sembra migliore della prima ma sempre con un rendimento di tremila? e se i primi tremila non sono certi perchè questi tremila dovrebbero invece essere certi?
GREM: Lei ha ragione, a volte mi mangio le parole, intendevo tremila mensili con una probabilità del novantanovevirgolanove percento di averli ogni mese e con una probabilità più bassa di ottenere qualcosa più di tremila, Le interessa? (apoteosi delle bastardate precedenti, lui gode a creare scompiglio nelle certezze altrui)
IARI: (sempre interdetto ma nella versione “mi è apparsa la Madonna”) No, scusi, continuo a non capire… ha detto veramente tremila al mese? vuol dire trentaseimla all’anno… sta scherzando?
GREM: (serissimo) se vuole glielo scrivo subito su un pizzino e poi lo mettiamo sul contratto, diciottopercento per il primo anno di operatività meno il mio onorario, poi dal secondo anno si può aumentare se lei vuole, col suo capitale si può sicuramente fare di più ma ci vorrà del tempo.
IARI: (con sintomi di incipiente vasodilatazione naso-facciale) Ma non vorrà mica propormi un fondo hedge… guardi che la storia di Madoff la conosco!
GREM: Stia tranquillo, niente fondi con me e nemmeno titoli strutturati o esotici o trattati su mercati poco liquidi o polizze o certificati… allora sarebbe disponibile anche ad impegnarsi attivamente per ottenere tremila mensili?
IARI: (è subentrata secchezza delle fauci e raucedine) Ma Lei sta parlando sul serio? mi fa forse mettere i soldi sui titolini della borsa italiana e del nasdaq, quelli che schizzano su e poi si sfracellano se li tieni troppo? e questi come li garantisce?
GREM: Ha ragione ancora, avevo dimenticato di dirle che con me niente azioni, al massimo pochi ETF in tendenza di mercato, ma solo al momento giusto e anche al ribasso, e in questa prima fase visto l’effetto bolla su azioni e commodity prodotto da un aumento abnorme di non circolante e dei relativi indebitamenti statali (un giorno le spiegherò perchè le banche centrali sono il cancro dell’economia reale) e l’attuale lateralità di medio periodo, non li inserirei proprio in portafoglio. Consideri che io non so fare previsioni e nemmeno credo alle previsioni di nessuno, per me non esistono guru, solo esperti che ogni giorno devono dimostrare di essere ancora esperti… conosce le opzioni? (finalmente il vero Grem!)
IARI: No… (deglutisce frastornato) so però che sono derivati come i future ma se le opzioni sono come il fib non voglio le opzioni (che dignità! tentativo infantile per dimostrare che ha fatto tesoro dell’esperienza passata, cioè dei pastrocci col fib)
GREM: Il fib come tutti i future è una trappola mortale per il privato, vero simbolo dell’avidità e dell’azzardo… (e per fortuna che il vice-boss ti aveva detto di non strizzarlo, sei proprio una bestia)… niente future con me, le opzioni sono diverse dal fib come la Carfagna è diversa dalla Bindi, sempre mammiferi sono ma restano comunque differenze importanti… io i miei soldi li metto solo in opzioni e in qualche raro etf e bond, solo questo so fare e ai miei clienti propongo solo quello che so fare… (pausa, IARI sta in silenzio e annuisce, allora Grem continua) Una cosa importante… lei in Italia e anche in Padania non troverà mai nessuno che le proporrà di operare come un option writer puro (poi le dico di cosa si tratta) nemmeno per una porzione risibile di un capitale consistente come il suo, e sa perchè? perchè sono in pochissimi quelli che maneggiano opzioni in proprio, e quelli che si sono limitati a leggere qualcosa senza peraltro capirci molto le considerano pericolosissime, pensano che sia solo roba da grossi operatori professionali… ripeto, io le uso tranquillamente da anni e sono soddisfatto… se lei mi conferma il suo interesse a saperne di più, preparo una bozza di progetto finanziario in cui è fattore irrinunciabile la sua disponibilità ad apprendere e partecipare attivamente alla gestione dei suoi soldi. Nel prossimo incontro le spiegherò in dettaglio cosa intendo proporle e cosa lei dovrà fare. Se è d’accordo mi metto al lavoro, preparo la bozza e poi ci rivediamo fra qualche giorno, che dice?
IARI: Va bene, però mi dovrà spiegare tutto per bene e poi seguirmi con pazienza…
GREM: (espressione da marpione, ma lui dentro è un puro) Per me non è solo un dovere spiegare tutto ma anche una necessità assoluta, e non solo dovrà contare sulla mia presenza costante, ma dovrà persino temerla perchè diventerò una sua ombra… (ragno che danzando nella sua tela si avvicina sempre più alla preda, tripudio della sua vanità… ma lui dentro è etico), lei dovrà pazientare e lavorare con me per qualche mese durante i quali io in pratica le farò un corso di sopravvivenza finanziaria e lei avrà modo di mettere in pratica tutto quanto in simulazione e da subito… e quando si sentirà pronto, inizieremo ad operare insieme per almeno un anno, ma di questo ne parliamo in dettaglio la prossima volta e non si faccia illusioni. I buoni risultati si ottengono solo con lo studio, l’applicazione e la giusta dose di rischio.
(A questo punto una precisazione è necessaria: il Grem agisce così per grande passione e grande narcisismo e siccome è pure presuntuoso, anche per il giusto compenso del suo lavoro; lui può dimostrare con carta canta come si opera con le opzioni e sa che prima o poi qualche invidioso lo additerà come uno stupido irresponsabile idealista pericoloso per gli investitori, ma con questi tipacci anche blasonati il Grem trova sempre un modo per rimetterli al loro posto, facile immaginare a quale posto si allude, no? Poi lui è un furbastro perchè avendo dimostrato ai suoi ammiratori mese dopo mese che per avere un ritorno di mille mensili basta un ventimila, chiedendo ora una copertura tre volte superiore potrà scoprirsi su strike OTM lontani anni luce riducendo il rischio in maniera vergognosa, praticamente meno di un BOT, e si riserva la possibilità di migliorare continuamente la performance nei secoli dei secoli, che dire di più? Ultimo: chiarirà molto bene a IARI perchè intende proporgli un’operatività in opzioni, prima come hedging di portafoglio e poi magari qualche scoperto puro, e se ci saranno titubanze accantonerà le opzioni; in questo primo colloquio ha ventilato l’idea, nel secondo a mente fredda sarà più facile valutarne la fattibilità. Lui ragiona così)
IARI: Okei, ma poi se tutto va bene si può ottenere anche un risultato migliore? da quello che lei ha detto prima mi è sembrato di capire questo… (mollusco trasportato dalle correnti del mare dell’avidità)
GREM: Certo che sì, ma di questo ne riparleremo fra un anno e faremo nuove valutazioni… le telefono per fissare il nuovo incontro, preveda pure due ore di colloquio. Le spiegherò la strategia finanziaria di breve e lungo periodo che intendo attuare con tecniche di strangolamento e di copertura basate su opzioni quotate in euro su un mercato serio. Intanto se le è possibile accedere a internet cominci da qui per avere un’infarinatura:
e anche da qui:
Per stare invece sul concreto non ha molta scelta, cominci col leggere le mie dissertazioni di un anno fa partendo da qui (dal commento 49): http://intermarketandmore.finanza.com/fib-trading-v-3197.html
e poi nelle dieci rubriche che si sono succedute fino ad oggi.
IARI saluta con un sorriso solo apparentemente disteso, in realtà è molto turbato perchè da una parte il diciottoallanno gli sembra un’enormità, praticamente una bufala, e dall’altra non ha capito assolutamente da dove dovrebbero spuntare i soldi (si chiede anche che roba è l’opscionraiter stramaledicendo l’inglese che non conosce bene e cosa c’entrano gli strangolamenti). Per fortuna che la signorina dell’ufficio l’ha preso appena in tempo per indicargli l’uscita, perchè lui così assorto stava già entrando nella toilette… ma per chiamare l’ascensore!


GREM II

Capitolo II – La rivelazione del bozzolo


Iari è tornato, sono passati pochi giorni dal primo incontro.
GREM: Allora, che idea s’è fatto delle opzioni?
IARI: Ho letto parecchio, sono rimasto con tanti dubbi e una sola certezza: tutto molto complicato!
GREM: Io invece non ho dubbi che lei abbia un sacco di dubbi, comunque faremo pratica in virtuale per qualche mese e poi sarà tutto più chiaro, vedrà pure i risultati… allora, le avevo proposto tremila mensili con un’operatività associata a un certo livello di rischio che poi quantificheremo esattamente al simulatore… la consapevolezza del tipo di rischio a cui si va incontro, sia in termini qualitativi che quantitativi, è la condizione primaria per l’avvio dell’operatività che oggi le mostro… vedrà comunque che questo rischio è prevedibile a tavolino e quindi siamo noi a determinarlo, gli eventi esterni e indipendenti dalla nostra volontà ci metteranno alla prova ma non saremo impreparati… però se il rischio connesso all’attività che le propongo sarà troppo alto per lei possiamo abbassarlo ma si ricordi che il maggior guadagno si accompagna sempre ad un maggior impegno operativo e maggior rischio, niente soldi facili in borsa… la priorità è dormire tranquilli per cui stabiliremo in anticipo dei livelli di guardia che precedono il segnale operativo per proteggerci da movimenti di mercato rapidi e impulsivi, magari considerati come improbabili nell’arco di tempo considerato nella nostra strategia ma pur sempre possibili e pericolosi… io opero con un approccio probabilistico e quindi non do mai niente per scontato, tutto è possibile, è per questo che io lavoro per ipotesi con un piano ordinario di lavoro mensile e con un piano già preventivato di modifica straordinaria, cioè di correzione in senso protettivo… il tutto viene costruito su un continuo monitoraggio dei mercati e del contesto macro… il punto cruciale è la valutazione del rischio e se questo rischio non fosse accettabile per lei possiamo ridurlo al minimo fino a rinunciare a qualsiasi guadagno extra, okei fin qui? (patti chiari, amicizia lunga, forse…)
IARI: in questi giorni ero così contento dei tremila e adesso me li fa già sparire? (ridacchia un po’ deluso ma cosciente d’essere stato riportato coi piedi a terra, d’altra parte l’aspetto più delicato di questo sistema non è tanto il rischio in sè quanto la sopportazione del rischio e quindi è molto più importante stressare questo aspetto e stroncare facili illusioni prima di mettersi a pianificare i possibili guadagni)
GREM: no i suoi tremila non li faccio sparire io, semmai sarà lei a rinunciare anche se penso che una persona con la sua esperienza dovrebbe farcela, d’altra parte quello che propongo a lei non è mica per tutti (bastardata da venditore ai limiti della più bieca manipolazione, ma Iari è un duro e Grem coi duri non si fa scrupoli perchè hanno un ego potente) … fra un po’ vediamo in simulazione i numeri che vengono fuori in base alle oscillazioni dell’indice di riferimento che sarà quello tedesco, il dax, così vedremo i guadagni e le eventuali perdite che si possono verificare se non seguirà le mie istruzioni… investiremo inizialmente la metà del suo capitale, l’altra metà la teniamo liquida per coprire i margini di garanzia che ci verranno richiesti per operare… questa prima allocazione vale sia per il virtuale che il reale, col tempo vedremo se sarà il caso di iniziare ad accumulare qualcosa in titoli obbligazionari legati all’inflazione per la costituzione di un capitale in un’ottica previdenziale, ma per ora concentriamoci sui rischi dell’azionario… allora, coi centomila ci compriamo un etieffe armonizzato che replica pari pari il dax e poi lo imbozzoliamo per bene fra call e put di prima scadenza, cioè febbraio… all’inizio del marzo borsistico, che per noi sarà sempre il quarto lunedì del mese cioè il 22 febbraio, costruiremo un nuovo bozzolo di opzioni con scadenza marzo e così per tutti i mesi a venire e a piacere suo, okei?
IARI: Bozzolo? Guardi che io non vado via da qui fino a che non ho capito tutto alla perfezione… e tanto per togliermi subito questo nuovo dubbio che mi ha appena creato vorrei sapere se l’acquisto delle opzioni deve essere fatto tassativamente il quarto lunedì del mese… e se fosse una altro giorno che succede?
GREM: No non c’è niente di tassativo, però è necessario che le operazioni vengano comunque fatte nei primi giorni del mese borsistico per non trovarci con prezzi depauperati dal tempo trascorso, tuttavia se il dax fosse in marcato rialzo potremmo lasciarlo crescere qualche giorno primo di imbozzolarlo ma questo al momento è solo un dettaglio, solo dopo aver acquisito esperienza non sarà più un dettaglio e con la pratica sarà tutto più chiaro ma adesso dobbiamo andare nel concreto… (qualche clic col mouse e nel monitor compaiono colonne di numeri, è il sito Eurex, call e put di febbraio, Grem spiega, Iari chiede, domande e riposte)
 (l’inizio)
IARI: Ora comincio a capire qualcosa di più, direi che è un qualcosa di geniale e intrigante il modo come sono correlate le opzioni in termini di prezzo fra loro sulle diverse basi, col tempo di scadenza e fra put e call, proprio un bel casino!
GREM: Già, però la complessità una volta capìta offre maggiori opportunità… lei che ha fatto il fib non potrà altro che apprezzare… tutta l’operatività la facciamo ruotare intorno all’etieffe che dobbiamo proteggere e magari potenziare con le opzioni, questa struttura di opzioni che metteremo intorno lo chiamiamo bozzolo.. questo bozzolo è un impianto flessibile che possiamo costruire come si vuole in base ai rischi che si vogliono prendere, prima le faccio vedere le contrattazioni di borsa in tempo reale da dove prendiamo i valori per iniziare col virtuale e poi costruiamo il bozzolo da tremila mensili praticamente certi, ma se lo riterrà troppo rischioso (repetita juvant) faremo una cosa più tranquilla che la protegge solo dai ribassi e per i guadagni ci rimetteremo alla bontà del dax, se sale si guadagna, se scende non si perde assolutamente nulla entro certi limiti e c’è pure da guadagnarci.
IARI: Noooo…. ma che dice? che mi fa guadagnare anche quando vado in perdita? ma mi faccia vedere subito ‘sto bozzolo che non riesco ad immaginarmelo… prima mi smonta la speranza dei tremila e adesso mi dice che guadagno anche quando il dax scende… allora si fanno i miracoli con queste opzioni… (ironico al cubo, in realtà non sta più nella pelle, colpa anche del Grem che lo sta tirando scemo, gatto e topo)
GREM: il bozzolo protegge e amplifica i guadagni entro certi livelli, uno di massimo e uno di minimo, se il dax supera questi livelli e lei non interviene come dico io e al momento che dico io, e questo è un mio preciso impegno contrattuale, lei rischia di perdere soldi suoi… ora entriamo un attimo in borsa e poi passiamo alle simulazioni, ecco qua… (ed ecco che Gremlin dà vita al secondo monitor che ha sempre tenuto spento, compaiono grafici, book, indici, tutto uno sfavillare di rosso e verde e numeri che cambiano rapidamente… Iari si avvicina, è interessato mica poco, osserva affascinato)… vede? questo è il grafico del dax… e questo è l’etieffe… il dax segna 6038 e l’etieffe è trattato intorno a 59,5… queste sono le proposte di vendita ed acquisto… cominciamo ad inserire questi dati nel simulatore (Grem passa all’altro monitor dove c’è il simulatore ma Iari è ipnotizzato dai grafici che danzano)
IARI: senta, ne approfitto per una cosa fuori tema, posso vedere le tiscali? secondo lei torneranno a due euri?
GREM: (pausa teatrale, Grem lo guarda fisso, occhi dilatati) Lei ha le tiscali? lei ha ancora le tiscali? a due euro? ma allora lei è bravissimo! pensi che qualche milione di persone l’ha comprata sopra i cento, c’è da consolarsi, no? peccato però che lei stia perdendo ancora l’ottantaepassapercento, ma gliele ha consigliate qualche anima pia? (un po’ di sano sarcasmo quando ci vuole, ci vuole!)
IARI: (Iari è un duro e incassa) Ho fatto diversi acquisti per mediare negli anni scorsi, pazienza… ho anche le unicredit a treequalcosa, si tornerà sopra i tre?
GREM: nooooooo! anche le unicredit… magari la prossima volta le dico se vale la pena tentare una cosa con le opzioni sul titolo ma ci devo studiare sopra… senta per oggi abbia pietà di me, se avesse pure i bond delle pampas e quelli al latte non melo dica, ma a questo punto apro una parentesi neanche tanto breve perchè voglio invece assolutamente sapere cosa ne pensa del mio approccio all’azionario, se condivide la mia filosofia bene altrimenti rischiamo poi di trovarci in disaccordo nei punti di svolta del mercato, e non sarebbe bello…
(la sottile sicurezza dei luoghi comuni)
GREM: La gente compra da sempre, è rialzista per grazia ricevuta, perchè da sempre gli è stato detto che quello è l’unico modo per entrare in borsa… i gestori del risparmio che offrono solo strumenti rialzisti si sono messi d’accordo nel dire che sul lungo periodo l’investimento azionario è sempre profittevole anche quando ci si trova nel mezzo di un pesante ribasso o quando i titoli sono chiaramente sopravvalutati come nel caso della bolla tecnologica del 2000 o della bolla finanziaria scoppiata nel 2007… questa del lungo periodo è una balla truffaldina che parecchia gente si beve passivamente non perchè è scema ma solo perchè non ha nè cultura specifica nè i mezzi per confutarla e soprattutto perchè all’occorrenza i gestori la sanno presentare in modo credibile, e poi perchè fino a poco tempo fa il risparmiatore medio non aveva alcuno strumento per fare il ribassista, a prescindere comunque dalla sua forma mentis che resta rialzista per imprinting, e anche lei, non se ne abbia a male, ne è l’ennesima conferma (altro colpo ma Iari è intelligente e soffre in silenzio per redimersi)… una prima differenza del mio approccio all’azionario sta nella durata dell’investimento, o meglio, nell’ipotesi di durata: niente lungo periodo come assioma ma solo quel tanto che basta per sfruttare decentemente un trend rialzista solido… tanto per chiarire le dico che il mio investimento non è un innamoramento per la vita perchè col tempo le cose cambiano e se i mercati scendono io non posso comprarli nè tanto meno tenere posizioni rialziste, è un non senso, oggi esistono gli etieffe ribassisti ed è lì che riposizioneremo l’azionario fra un po’ di mesi… le ho detto questo perchè io la penso diversamente dai gestori che devono vendere i loro fondi e lei deve saperlo.
IARI: Ma prevede un altro crollo?
GREM: No, io non prevedo niente perchè non sono capace, ritengo solo molto probabile l’avvio di una marcata correzione entro quest’anno che di per sè non vuol dire che manderà tutti in rovina, ma sarebbe stupido star lì con una posizione rialzista quando il mercato imbocca un trend discendente di medio periodo… però anche se ora ho buoni motivi per rimanere rialzista so che la fregatura ti capita all’improvviso, come la storia del Dubai per citare la più recente anche se è durata pochissimo, e io voglio sempre avere le opzioni in canna per non regalare niente… secondo me tutti gli investitori sull’azionario dovrebbero porsi alcuni interrogativi, il primo l’ho appena detto: se i mercati scendono cosa sarà del nostro investimento se non è protetto? I gestori, che proteggono in primis il loro didietro e non i risparmi che raccolgono, non hanno dubbi: continuare ad investire periodicamente, cioè ti fanno il pac… peccato che questo consiglio sia viziato da un conflitto di interessi grande come l’universo… io il pac lo consiglio quando i mercati salgono e non quando scendono, quando scendono si va al ribasso e basta, con gli etieffe ribassisti… altro quesito: e se invece i mercati salgono un po’ e poi scendono ma non tanto e poi risalgono ma non tanto, eccetera… in una situazione così indefinita e ballerina che si trascina per mesi e mesi, cosa si dovrebbe fare? il gestore non ha dubbi: a maggior ragione continuare ad investire nei suoi fondi anche nei periodi laterali, e che palle! se però lei gli chiede quando i prezzi torneranno a salire con decisione visto che il mib è ancora lontano anni luce dal massimo del duemilasette e ancor di più dal massimo del duemila, allora il gestore più corretto del mondo non potrà altro che dirle che nessuno lo sa, ma che nel lungo periodo si rivedono sempre i prezzi precedenti anche se le performance del passato non garantiscono le performance del futuro… io a sentire queste fregnacciate mi faccio ancor oggi un fegato così, soprattutto se penso alle Generali che da sempre, cioè da quando Andreotti era in fasce, vengono decantate come un investimento solido, dividendo garantito, sai quanti immobili ha, non può fallire, gli immobili si rivalutano sempre e avanti con questa tiritera per decenni e ora quali performance può vantare chi le ha comprate dieci anni fa? e allora di quale lungo periodo stiamo parlando? mica siamo tutti eterni come Andreotti… se io dopo dieci anni sono sotto del 50% più l’inflazione ufficiale più quella reale, o picchio la mia testa contro il muro dandomi dell’asino o ci picchio quella di chi mi ha dato questi preziosi consigli…  e se invece il gestore non fosse tanto corretto allora le spiattella le sue rassicuranti previsioni del futuro… io vorrei che lei diffidasse sempre da chiunque faccia previsioni sull’andamento dei mercati, soprattutto se queste previsioni sono finalizzate ad un qualsiasi proprio tornaconto o se sono le previsioni annuali fatte ad inizio anno, tradizione tanto triste quanto inutile per l’operatività… pensi che bello se oggi qualche superguru americano dicesse: quest’anno prevedo di non essere capace di fare alcuna previsione credibile visto l’attuale sconquasso internazionale finanziario e morale, i mercati sono manipolati più che mai da lobby potentissime che si accordano o litigano fra loro, e loro possono tutto, e io che ne so quando vorranno fare cosa? l’unica previsione che mi sento di fare, anzi l’unica certezza che mi sento di anticipare è che gli investimenti azionari che non prevedono una forma efficace di protezione dai ribassi sono esposti ad un maggiore rischio di distruzione rispetto al 2007.
IARI: Ma lei crede veramente che si possono manipolare contemporaneamente tutte le borse più importanti?
GREM: Certo che ci credo altrimenti non riuscirei nemmeno a concettualizzare l’idea di un bozzolo…quasi nessun fondo azionario protegge il capitale dei sottoscrittori… ci sono due etieffe rialzisti quotati in Italia che promettono protezione ma in realtà hanno fatto schifo, vere bufale… su certe cose raglio e deraglio però adesso sa come la penso, torno in tema che è meglio, dài che adesso comincio a dare i numeri ma quelli utili! (Grem aggiunge nel simulatore altre cose)… guardi qui e mi dica se non è un numero di alta acrobazia questo bozzolone!
(ce la farà anche questa volta? la sfida al mercato di febbraio è lanciata – continua)

Ed eccolo qua il portafoglio virtuale, è questo che seguirò e commenterò di volta in volta senza aspettare il prossimo post (opzioni febbraio e etf ai prezzi di riferimento di venerdì 8 gennaio):
+ 1.680 etf dax caricati a 59,59 spese incluse con dax a 6038
+ 3 put 6050 a 157,3
- 60 put 5200 a 12,7
- 60 call 6600 a 7,7
Si parte con un incasso netto di 3.436€ (“e anche questa promessa l’abbiamo mantenuta” direbbe qualcuno) e prezzo dell’etf di 59,59 caricato delle spese (0,15%). Il massimo guadagno è a 6600 con +12.718€; a 5200 il guadagno si riduce a +2.263€ malgrado la caduta dell’etf del 13,9%. Un bel numero o no? Bozzolo buono per tutti i mesi variando opportunamente gli strike. Se entro il 19 febbraio quei livelli vengono superati, i guadagni svaniscono e si inizia a perdere di brutto, e allora bisogna fare qualcosa prima di raggiungere 6600 o 5200: poniamo allora una prima soglia di attenzione a 6400 e 5500, seguiranno poi i livelli di intervento veri che vengono definiti solo al momento in base alla situazione reale, cioè forza di mercato e giorni alla scadenza. Questo è il rischio a cui si va incontro e quindi occorre sapere come affrontarlo e gestirlo; c’è da dire che questi livelli sono abbastanza lontani, cioè la probabilità che vengano raggiunti entro sei settimane è molto bassa per le put e non troppo bassa per le call visto che siamo in un torello, ma c’è tempo per preoccuparsi, il mondo è pieno di Dubai, il bozzolo è solido e, se serve, sarà facilmente fortificato ma sempre nel rispetto dei tremila mensili almeno… Ultima cosa la marginazione: sono le call che daranno fastidio e io non so se il broker di Iari terrà buoni almeno parzialmente i centomila in etf; nell’ipotesi che ci si debba affidare solo sui centomila liquidi allora non sarei molto tranquillo: alla peggio si partirà con un etf da ottanta o settantamila, la liquidità aumenta, le call si riducono a 50 e i 3.436 iniziali diventano 2.826: fra 6040 e 6600 si va sempre alla grandissima e in caso di discesa ci vorrà invece un attimo con una vendita extra per recuperare gli spiccioli mancanti.
Un ennesimo promemoria: questo non è trading sulle opzioni, diffidate dalle imitazioni, questo è OPZIONISMO…
Chi s’è perso il capitolo I lo trova qui

1. Quanto voglio guadagnare? (con le opzioni)

    Methodological Option Approach – lesson 1

    Dài che scherzo, nessuna lesson uan, solo opinioni…
    Non scherzo invece per niente sul fatto che prima di fare qualsiasi investimento (o speculazione) devo darmi un obiettivo di guadagno e fissare un limite alla mia perdita.
    Il “quanto voglio guadagnare” non è sbruffoneria ma elemento fondante del metodo di investimento e inizialmente prescinde dallo strumento finanziario perchè la scelta di questo avverrà in un secondo tempo. Il “quanto voglio guadagnare” è solo introspezione. Mai pensare che psicologia individuale e risultati dell’investimento siano scollegati.


    Chi sono io
    Sono risparmiatore, investitore o speculatore? già la risposta è complicata di per sè e se poi ci aggiungiamo la difficoltà di attribuire un significato univoco alla terminologia la babele è assicurata.
    Qui mi limito a dire che se io sono colui che vuole recuperare la perdita di potere d’acquisto del proprio capitale non posso essere un risparmiatore. Il risparmiatore usa il porcellino e i bot (sic).
    Più che sottilizzare fra investitore e speculatore sempre qui mi limito a dire che nessuno dei due DOVREBBE essere un giocatore d’azzardo.
    E allora chi è il giocatore d’azzardo? semplice: è colui si prende dei rischi senza essere in grado nè di quantificarli a priori nè di controllarli, perchè non è tecnicamente possibile o per semplice propria incapacità e incoscienza; chiaramente non ha metodo e ha scarse conoscenze dello strumento e del mercato in cui va ad infilarsi.
    E ora che ho introdotto pure la figura dell’investitore d’azzardo e dello speculatore strategico metodologicamente corretto che si fa? (in primis non si leggono libri come quello della figura…)
    Voglio recuperare la perdita di potere d’acquisto del mio capitale
    Questo è un chiaro obiettivo ben formulato, quantificabile, da cui impostare una strategia. Se compro azioni obbligazioni, direttamente o tramite fondi e etf, e li tengo lì per mesi o anni, sono un investitore che al momento dell’investimento non poteva fare alcuna pianificazione dei possibili guadagni. Se a qualcuno questo passaggio risulta sibillino scriva, che ci picchio giù duro per amor di chiarezza…
    Se faccio invece il fib tutti i giorni significa che ho ancora il mio capitale e quindi sono uno speculatore abile e metodico in grado di quantificare i propri guadagni medi settimanali e mensili e posso quindi perseguire l’obiettivo con buone probabilità di successo. Peccato che questi trader vincenti sono una manciata e che la loro metodologia il più delle volte non è replicabile perchè molto legata alla sensibilità individuale. In altre parole non possono essere presi come modello per raggiungere l’obiettivo.
    Allora torno ad essere investitore, ma questa volta “dinamico” e non cassettista, e divento speculatore… ma ho una strategia e un metodo? ho le conoscenze tecniche e gli strumenti adatti per controllare il rischio? ognuno risponda per sè!
    In pratica: ho diecimila da proteggere dall’inflazione reale e decido che la “mia” inflazione reale è il 12%. Devo allora ottenere a fine anno un incremento del capitale di milleduecento, ovvero cento euro al mese.
    Chi è capace di PIANIFICARE oggi cento euro mensili per dodici con diecimila in dotazione è pregato di farsi vivo e di spiegare come fa.
    Con le si può pianificare 100 euro/mese
    Ho detto che si può pianificare a tavolino e non guadagnare a tavolino. Ma se ci pensate nessuno strumento tranne le permette di pianificare alcunchè, permette solo di sperare…
    Pianificare con lo strumento adatto è il primo passo per raggiungere l’obiettivo. E che hanno di miracoloso le ? niente di speciale, puoi solo incassare subito quello che vendi, puoi costruirti un profilo di rischio, puoi programmare interventi di protezione, puoi decidere di sfruttare la lateralità o la direzionalità dei mercati, puoi fare anche altro, ma niente di miracoloso. Ti devi fare solo un culo così per capirci ma niente di sovrumano, magari si comincia con questo graficuzzo…

    19/10/10

    spiega indicatori

    The contents of the Accumulation/Distribution Line are explained in detail under the discussion of the Chaikin Oscillator (Chaikin A/D Oscillator).  Briefly, the indicator is:

        { [(close-low) – (high-close) / (high-close) ]  x volume} + I

    Where "I" is yesterday's Accumulation/Distribution value.

     is a cumulative total of the Swing Index (see Swing Index).
    The Swing Index seeks to isolate the "real" price of a security by comparing the relationships between the current prices (i.e., open, high, low, and close) and the previous period's prices.
    The Swing Index requires opening prices.

    is a line study consisting of three parallel lines.  The lines are drawn from three points that you select.
    The three trendlines are drawn as follows:  The first trendline begins at the left-most point selected and is drawn so it passes directly between the right-most points.  This line is the handle of the pitchfork.  The second and third trendlines are then drawn beginning at the right-most points and are drawn parallel to the first line.  These lines are the tines of the pitchfork.

    The True Range indicator is defined by Wilder to be the greatest of the following for each period:

    ·              The distance from today's high to today's low.
    ·              The distance from yesterday's close to today's high.
    ·              The distance from yesterday's close to today's low.
    ·              The Average True Range is simply the average of the true ranges over the past x periods (where x
     is specified by the user).

    are a type of envelope (see Envelope) developed by John Bollinger.  However, where envelopes are plotted at a fixed percentage above and below a moving average, Bollinger Bands are plotted at standard deviation levels above and below a moving average.
    You may find the expert named "Equis - Bollinger Bands" helpful in interpreting Bollinger Bands.  See Attaching an Expert to a Chart for more information an experts.For information on products and services offered by John Bollinger contact Bollinger Capital Management at 1-310-798-8855.
      
    The Japanese developed a method of technical analysis in the 1600s to analyze the price of rice contracts.  This technique is called Candlestick charting.
    Candlestick charts display the open, high, low, and closing prices in a format similar to a modern-day bar-chart.  Articles written by Steven Nison that explain Candlestick charting appeared in the December, 1989 and April, 1990 issues of Futures Magazine.  The definitive book on the subject is Japanese Candlestick Charting Techniques also by Steve Nison
    You may find the expert named "Equis - Candlesticks" helpful in interpreting Candlestick patterns.  See Attaching an Expert to a Chart for more information an experts.Some investors are attracted to Candlestick charts by their mystique--maybe they are the "long forgotten Asian secret" to investment analysis.  Other investors may be turned-off by their mystique.  Regardless of your feelings about the mystique of Candlestick charting, we strongly encourage you to explore their use.  Candlestick charts dramatically illustrate supply/demand concepts defined by classical technical analysis theories. 
    IMPORTANT:  Because Candlesticks display the relationship between the open, high, low, and closing prices, they cannot be displayed on securities that only have closing prices, nor were they intended to be displayed on securities that lack opening prices.  If you attempt to display a Candlestick chart on a security that does not have opening prices, MetaStock Pro will use the previous period's closing prices in place of opening prices.  Note that this technique can create
    Candlestick lines and patterns that are not valid (e.g., the previous period's close may have been outside the current period's high-low range).

    Candlevolume charts are a unique hybrid of the Equivolume and Candlestick charting methods.  A candlevolume chart possesses the shadows and empty/filled body characteristics of Candlestick charts, plus the volume-based body width of Equivolume charts.  This combination gives you the unique ability to study Candlestick patterns in combination with their volume.


    Like the popular Chaikin A/D Oscillator developed by Marc Chaikin, the Chaikin Money Flow indicator is based on the Accumulation/Distribution line.  It is created by summing the values of the Accumulation/Distribution Line for 21 periods and then dividing by a 21 period sum of the volume.
    sum(((( C-L )-( H-C )) / ( H-L ))*V,21 ) / sum(V,21)


    The color/style page allows you to change the color, line style, and weight of the selected price plot.  You can also make these changes by using the color and line style toolbars (see Color and Line Style Toolbars).
    Price Styles.  Click on the Price Style drop-list to display the nine price styles: Bars, Candlesticks, Candlevolume, Equivolume, Line, Kagi, Point & Figure, Renko, and Three Line Break.
    Up.  Use this drop-list to select the color when the closing price moves upward (as compared to the previous period's price).  Note that this color only affects the currently selected Price Style.  If an expert containing a Highlight is attached to the chart (and its condition is true), the Highlight's color will override this setting.
    Down.  Use this drop-list to select the color when the closing price moves downward (as compared to the previous period's price).  Note that this color only affects the currently selected Price Style.  If an expert containing a Highlight is attached to the chart (and its condition is true), the Highlight's color will override this setting.
    Weight.  Use this drop-list to select the weight (i.e., thickness) of the price plot.
    Apply To All Price Styles.  Check this box if you want the Up and Down colors selected for the current price style to apply to all Price Styles (rather than just the currently selected Price Style).

    The Commodity Channel Index (CCI) is calculated by first determining the difference between the mean price of a commodity and the average of the means over the time period chosen.  This difference is then compared to the average difference over the time period (this factors in the commodity's own inherent volatility).  The result is then multiplied by a constant that is designed to adjust the CCI so that it fits into a "normal" trading range of +/-100. A complete explanation of the CCI is beyond the scope of the manual.  Further details on the contents and interpretation of the CCI can be found in the October 1980 issue of Commodities magazine (now known as Futures).  The article was written by Donald Lambert.
    The CCI indicator used in older versions of MetaStock is called "CCI (EQUIS)."  "CCI (Standard)" is the recently modified version that is consistent with the author's current calculation method.  The interpretation of both methods is identical.
    See Plotting an Indicator for more information on plotting indicators.  See Commodity Channel Index (CCI) for more information on the CCI parameters.

    The CSI is calculated using the ADXR component of the Directional Movement indicator.  Refer to New Concepts in Technical Trading Systems (see Suggested Reading) for more information on the calculation and interpretation of the indicator.

    Displaying the Trend in the Expert Corner
    The expert corner is a small area located in the bottom corner of the chart where the x-and y-axes meet.  This area is reserved for the display of a symbol.  The symbol indicates the current trend (i.e., for the last bar loaded in the chart) of the security. The rules that define expert corner symbol are created in the Trend page of the Expert Editor dialog (see Defining Bullish and Bearish Trends). 
    A user defined symbol will appear if the current state is bullish, bearish, or neutral.  If the state is confused (see Defining Bullish and Bearish Trends), the symbol for neutral will appear.  If the state is undefined, no symbol will appear.
    The color and style of the symbol is controlled from the Expert Corner dialog.  This dialog is displayed by choosing the Corner button on the Trend page of the Expert Editor dialog. 
    Display Symbol in Expert Corner.  Check this box if you want symbols displayed in the Expert Corner area of the chart.
    Symbol.  Choose the symbol to use for the bullish, bearish, and neutral state of the security.
    Color.  Choose the color to use for the symbol.  Be sure to choose a color that is different from the background color of the expert.  Otherwise, the symbol will not be visible.

    The purpose of correlation analysis is to measure the relationship between two variables.  This relationship is called the "correlation coefficient." 
    The correlation coefficient ranges between ±1.0.  A coefficient of +1.0 is a perfect positive correlation and -1.0 is a perfect negative correlation.  Two variables with no relationship will have a coefficient of zero.

    Cycles allow us to accurately predict events in nature: bird migrations, the tides, planetary movements, etc. You can also use cycle analysis to predict changes in financial markets, although not always with the accuracy found in nature.
    We know that prices are a consensus of human expectations.  These expectations are always changing, shifting the supply/demand lines (see Support and Resistance Levels), and causing prices to oscillate between overbought and oversold levels. Fluctuations in prices are a natural process of changing expectations and lead to cyclical patterns.
    .
    Delta shows the amount that the option's price will change if the underlying security's price changes by $1.00. 
    For example, if XYZ is selling for $105.00/share, a call option on XYZ is selling for $2.00 and the Delta is 75%, then the option's price should increase $0.75 (to $2.75) if the price of XYZ increases to $106.00/share.  In other words, the option should go up $0.75 for each $1.00 that XYZ goes up.

     developed by James Sibbet, combines price and volume in such a way that it is often a leading indicator of price change.  The Demand Index calculations are too complex, however, for this text.  The calculations require 21-column accounting paper to calculate manually.
    MetaStock Pro uses a slight variation on the Sibbet's original Index so that the Index is displayed on a "normal" y-axis scale.  The author's Index is plotted on a scale labeled +0 at the top, 1 in the middle, and -0 at the bottom.  MetaStock Pro uses a scale from +100 to -100.  Other than the difference in y-axis labeling, the indicator is calculated exactly as designed by its author.

    The Detrended Price Oscillator (DPO) is an indicator that attempts to eliminate the trend in prices.  Detrended prices allow you to more easily identify cycles and overbought/oversold levels.
    The calculation is quite simple; you simply center an x-period moving average by shifting it back x/2 + 1 periods.  This centered moving average is then subtracted from the close.  The result is an oscillator that crosses above and below zero.
    Since the DPO is shifted back "x/2 + 1" periods, the last "x/2 + 1" periods will have no values. 
    MetaStock Pro prompts you to enter the number of periods.  The value entered should be the approximate length of the cycle you wish to identify.  Cycles longer than the number of periods you enter will not be shown.  The default value is 20.

    There are five indicators comprising the Directional Movement system: +DI, -DI, ADX, ADXR, and DX.
    The parameters for the Directional Movement indicators are shown below.  These parameters are specified at the time the indicator is plotted.  You can edit the parameters of an existing plot by right-clicking on the indicator and choosing Properties from the shortcut menu.
    Time Periods.  Enter the number of time periods to use when calculating Directional Movement.  The term "time periods" refers to days if the chart contains daily data, weeks for weekly data, hours for hourly data, etc.
    The parameters for the Dynamic Momentum Index are shown below.  These parameters are specified at the time the indicator is plotted.  You can edit the parameters of an existing plot by right-clicking on the indicator and choosing Properties from the shortcut menu.
    Price Field.  Choose the price field (i.e., open, high, low, or close) to use when calculating the Dynamic Momentum Index.
    The Dynamic Momentum Index (DMI) was developed by Tushar Chande and Stanley Kroll.  The indicator is covered in detail in their book The New Technical Trader.
    The DMI is identical to Welles Wilder's RSI (see Relative Strength Index) except the number of periods is variable rather than fixed.  The variability of the time periods used in the DMI is controlled by the recent volatility of prices.  The more volatile the prices, the more sensitive the DMI is to price changes.  In other words, the DMI will use more time periods during quiet markets, and less during active markets.  The maximum time periods the DMI can reach is 30 and the minimum is 3.  This calculation method is similar to the Variable Moving Average, also developed by Tushar Chande (see Moving Averages).
    The advantage of using a variable length time period when calculating the RSI is that it overcomes the negative effects of smoothing, which often obscure short-term moves.
    The volatility index used in controlling the time periods in the DMI is based on a calculation using  a five period standard deviation and a ten period average of the standard deviation. 

     was developed by Richard W. Arms, Jr., best known for the popular Arms Index and the Equivolume charting method.  The Ease of Movement indicator is a product of the Equivolume charting method.  The Ease of Movement indicator provides one value (for each time period) representing the price and volume for that period.  It calculates the ease at which prices are moving.  The larger the price move and the lighter the volume, the easier the movement.
    The raw Ease of Movement values is usually smoothed by a moving average.

    An envelope is comprised of two moving averages (see Moving Averages).  One moving average is shifted upward and the second moving average is shifted downward.  The envelope is plotted around a price plot or indicator.

    Developed by Richard W. Arms, Jr., and explained in his book Volume Cycles in the Stock Market (see Suggested Reading), Equivolume presents a highly informative picture of market activity for stocks, futures, and indices.
    Equivolume departs from other charting methods with its emphasis on volume as an equal partner with price.  Instead of being displayed as an "afterthought" on the lower margin of a chart, volume is combined with price in a two-dimensional box.  The top line of the box is the high for the period and the bottom line is the low for the period.  The width of the box is the unique feature of Equivolume charting; it represents the volume of trading for the period.The width of the box is controlled by a normalized volume value.  The volume for an individual box is normalized by dividing the actual volume for the period by the total of all volume displayed on the chart.  Therefore, the width of each Equivolume box is based on a percentage of total volume, with the total of all percentages equaling 100.
    The resulting charts represent an important departure from all other analytical methods, in that time becomes less important than volume in analyzing price moves.  It suggests that each movement is a function of the number of shares or contracts changing hands rather than the amount of time elapsed.Perhaps the Equivolume charting method is best summed up by the developer himself as follows:  "If the market wore a wristwatch, it would be divided into shares, not hours."

    Leonardo Fibonacci was an important mathematician who was born in Italy around the year 1170.  It is rumored that Fibonacci discovered the relationship of what are now referred to as Fibonacci numbers while studying the Great Pyramid of Giza in Egypt.
    Fibonacci numbers are a sequence of numbers in which each successive number is the sum of the two previous numbers:
    1, 1, 2, 3, 5, 8, 13, 21, 34, 55, 89, 144, 233, 377, 610, etc.
    The parameters for Fibonacci Time Zones are shown below.  You can edit the parameters of Fibonacci Time Zones that are already plotted by right-clicking on them and choosing Fibonacci Time Zones Properties from the shortcut menu.
    Date.  This is the date/time on which the dotted "reference" line is drawn.  The remaining time zone lines are drawn to the right of the reference line at the predefined Fibonacci intervals.
    Show Lines in All Windows.  Check this box if you want the time zones to extend vertically across all inner windows within the chart.
    For general information on line studies, see  Drawing a Line Study.  For interpretation information on Fibonacci Time Zones, see  Time Zones.
    1, 1, 2, 3, 5, 8, 13, 21, 34, 55, 89, 144, 233, 377, 610, etc.
    These numbers possess an intriguing number of interrelationships, such as the fact that any given number is approximately 1.618 times the preceding number and any given number is approximately 0.618 times the following number.  The booklet Understanding Fibonacci Numbers by Edward Dobson (see Suggested Reading) contains a good discussion of these interrelationships.

    The Forecast Oscillator is an extension of the linear regression based indicators made popular by Tushar Chande.  The Forecast Oscillator plots the percentage difference between the forecast price (generated by an x-period linear regression line) and the actual price.  The oscillator is above zero when the forecast price is greater than the actual price.  Conversely, it's less than zero if its below.  In the rare case when the forecast price and the actual price are the same, the oscillator would plot zero.
    For more on linear regression analysis see   Linear Regression Trendline,  Linear Regression Indicator, and  Time Series Forecast.

    Option Gamma shows the anticipated change in Delta, given a one point increase in the underlying security.  Thus, it shows how responsive Delta is to a change in the underlying security's price.  For example, a Gamma of four indicates that the Delta will increase four points (e.g., from 50% to 54%) for each one point increase in the underlying security's price.

     W. D. Gann (1878-1955) designed several unique techniques for studying price charts.  Central to Gann's techniques was the use of geometric angles in conjunction with time and price.  Gann believed that specific geometric patterns and angles had unique characteristics that could be used to predict price action. All of Gann's techniques require that equal time and price intervals be used on the charts, so that a rise/run of 1 x 1 will always equal a 45 degree angle.Gann believed that the ideal balance between time and price exists when prices rise or fall at a 45 degree angle relative to the time axis.  This is also called a 1 x 1 angle (i.e., prices rise one price unit for each time unit).

    A bar chart is the most popular way to display security prices.  A bar chart is made up of vertical bars, with each bar representing the price movement for a time period (i.e., hour, day, week, month, etc.).  Hash marks on the left and right sides of the bar represent the opening and closing prices respectively.  The top of the bar represents the high price and the bottom of the bottom represents the low price.

    The Intraday Momentum Index (IMI) was developed by Tushar Chande.  It is a cross-breed between the RSI (see Relative Strength Index) and candlestick analysis (see Candlesticks, Japanese
    ).  For more information on the IMI, refer to the book The New Technical Trader by Tushar Chande and Stanley Kroll.
    The calculation of the IMI is very similar to the RSI, except it uses the relationship between the intraday opening and closing prices to determine whether the day is "up" or "down."  If the close is above the open, it is an up day.  If the close is below the open it is a down day.  Therein lies its tie to candlestick charting.  For those familiar with candlestick charting, the IMI separates the black and white candlesticks and performs a RSI calculation on the candlestick bodies.

    The Moving Average Convergence/Divergence indicator (MACD) is calculated by subtracting the value of a 0.075 (26-period) exponential moving average from a 0.15 (12-period) exponential moving average.  A 9-period dotted exponential moving average (the "signal line") is automatically displayed on top of the MACD indicator line.
    You may find the expert named "Equis - MACD" helpful in interpreting the MACD indicator. 
    .
    In his book, Trading Chaos, Dr. Bill Williams, introduces a unique method of combining price action with volume.  The main component of this method is a simple indicator he developed called the Market Facilitation Index (MFI).
    The MFI simply divides the day's range (high to low) by the total volume.  The result shows the efficiency of price movement by quantifying the price movement per unit of volume.

    The Mass Index, popularized by Tushar Chande and Donald Dorsey (see the June 1992 issue of Technical Analysis of Stocks & Commodities magazine), is calculated by summing an exponentially smoothed moving average of the daily ranges (High-Low) over 25 periods. 
    The Mass Index is designed to identify reversals in trend by measuring the narrowing and widening of the average range between the high and low prices.  As the range widens, the Mass Index increases.  As the range narrows, the Mass Index decreases

    The Median Price indicator is calculated by adding the high price and the low price together, and then dividing by two.  The result is the average, or median, price.
    Median Price = (high+low)/2

    The MESA Sinewave indicator was developed by recognized cycle specialist John Ehlers.  The MESA Sinewave indicator looks like a sinewave when the market is in a cycle mode and tends to wander when the market is in a trend mode.  The MESA Sinewave indicator anticipates cycle mode turning points rather than waiting for confirmation as is done with most oscillators.  The MESA Sinewave indicator has the additional advantage that trend mode whipsaw signals are minimized.
    The Sine Wave indicator was introduced in the November 1996 issue of Technical Analysis of Stocks & Commodities magazine.

    The momentum of a security is the ratio of today's price compared to the price x-time periods ago.  The formula equivalent of the calculation is shown below:
    Momentum =  [close / ref(Close,-10) ] x 100
    Where:
    ref(Close,-10) = The closing price 10 periods ago

    The Money Flow Index (MFI) attempts to measure the strength of money flowing in and out of a security.  It is closely related to the Relative Strength Index (RSI); however, the Money Flow Index accounts for volume action.  The RSI incorporates price action only.
    Money flow (not the Money Flow Index) is calculated by determining the average price for the day and then comparing this figure to the previous day's average price.  If today's average price is greater, it is considered positive money flow.  If today's average price is less, it is considered negative money flow.  Money flow for a specific day is calculated by multiplying the average price by the volume. 
    Money Flow = volume x average price
    Positive Money Flow is the sum of the positive money flow over the specified number of periods.  Negative Money Flow is the sum of the negative money flow over the specified number of periods.
    Money ratio = positive Money Flow / negative Money Flow
    Finally, the Money Flow Index is calculated using the following formula:
    Money Flow Index (MFI) = 100 – [100/(1+Money ratio )]

    A moving average is a method of calculating the average value of a security's price, or indicator, over a period of time.  The term "moving" implies, and rightly so, that the average changes or moves.  When calculating a moving average, a mathematical analysis of the security's average value over a predetermined time period is made.  As the security's price changes over time, its average price moves up or down.
    MetaStock Pro calculates and displays six different types of moving averages:  simple (also referred to as arithmetic), exponential, time series, triangular, variable, and weighted.  In addition, MetaStock Pro will calculate moving averages of the security's open, high, low, close, median price, typical price, volume, open interest, or indicator. 
    The only significant difference between the various types of moving averages is the weight assigned to the most recent data.  Once this "weighting" scheme has been determined, it is held static over the range of calculations.  The exceptions are the variable moving average and volume adjusted moving average.  The variable moving average automatically adjusts its weighting based on market conditions.  A variable moving average becomes more sensitive to recent data as volatility increases and less sensitive to recent data as volatility decreases.  Similarly, the volume adjusted moving average automatically adjusts as the security's volume increases and decreases.


    relates a decrease in volume to the change in the security's price.  When volume decreases from the previous day, the NVI is adjusted by the percentage change in the security's price.
    If (V < (ref(V,-1)) then
    NVI = I + (((C - ref(C,-1) / ref(C,-1)))
    If (V >= ref(V,-1)) then
    NVI = I
    Where:
    C                            =             Today's closing price
    ref(C,-1)    =             Yesterday's closing price
    I                             =             Yesterday's Negative Volume Index
    NVI                         =             Today's Negative Volume Index
    V                            =             Today's volume
    ref(V,-1)    =             Yesterday's volume

    The NVI is constructed so it only displays changes on days when volume decreases from the previous day.  Because falling prices are usually associated with falling volume, the NVI will usually trend downward.
    See Plotting an Indicator for more information on plotting indicators.  See Negative Volume Index for more information on the NVI parameters.

    The Option Expiration indicator shows the month to month expiration cycle of stock and index options.  It is designed primarily to help in the development of more robust trading systems using the indicator's function (see Option Expiration for more information on the Option Expiration function).  The visual interpretation of the plot itself is of little value as it simply shows the number of days until the next monthly option expiration date.Stock and Index options expire on the Saturday following the third Friday of each month.  Options may be written for one of three cycles.  New options can be written every three months, with cycles beginning in January, February, and March.
    The option expiration day in the months of March, June, September, and December are referred to as "triple witching."  On these days, stock options, index options, and index futures all expire simultaneously.  For this reason, triple witching days are often very volatile.
    Since options officially expire on Saturdays (a non-trading day), the Next Option Expiration indicator's value on the Friday before expiration will be 1.00—meaning one day until expiration.  This is also consistent with the way the Option Life function calculates (see Option Life).
    Some of the most active days in the history of the markets have occurred at option expiration.  Because of the increasing use of options by both small and large investors as a means of hedging and speculating, it may be wise to consider the potential increase in volatility that can occur in the underlying security on option expiration days.

    The Positive Volume Index (PVI) relates an increase in volume to the change in the security's price.  When volume increases from the previous day, the PVI is adjusted by the percentage change in the security's price.
    If (V > ref(V,-1)) then
    PVI = I + (((C - ref(C,-1)) / ref(C,-1)))
    If (V <= ref(V,-1)) then
    PVI = I
    Where:
    C                            =             Today's closing price
    ref(C,-1)    =             Yesterday's closing price
    I                             =             Yesterday's Positive Volume Index
    PVI                         =             Today's Positive Volume Index
    V                            =             Today's volume
    ref(V,-1)    =             Yesterday's volume

    The PVI is constructed so it only displays changes on days when volume increases from the previous day.  Because rising prices are usually associated with rising volume, the PVI will generally trend upward.

    The Price Oscillator displays the difference between two moving averages of the security's price.  The difference between the averages can be expressed in either points or percentages.

    The Price Rate-Of-Change (R.O.C.) indicator (percent method) is calculated by dividing the price change over the last x-periods by the closing price of the security x-periods ago.  The result is the percentage that the security's price has changed in the last x-periods.
    If the security's price is higher today than x-periods ago, the R.O.C. will be a positive number.  If the security's price is lower today than x-periods ago, the R.O.C. will be a negative number.
    The Price Volume Trend (PVT) is similar in concept to On Balance Volume (see On Balance Volume) in that it is a cumulative total of volume that is adjusted depending on changes in closing prices.  But whereas OBV adds all volume on days when prices close higher and subtracts all volume on days when prices close lower, the PVT adds only a portion of the daily volume.  The amount of volume added to the PVT is a function of the amount by which prices rose or fell relative to the previous day's close.

    PVT = (((C-ref(C,-1)) / ref(C,-1)) * V) + I
    Where:    
    C                            =             Today's closing price
    ref(C,-1)    =             Yesterday's closing price
    V                            =             Today's volume
    I                             =             Yesterday's Price Volume Trend
    The PVT is calculated by multiplying the day's volume by the percentage change of the underlying security and adding this value to a cumulative total.  For example, if the security closed up 0.5% and volume was 10,000 shares, we would add 50 (i.e., 0.005 * 10,000 = 50) to the PVT.  If the security had closed down 0.5%, we would have subtracted 50 from the PVT.

    Developed by Mel Widner, Ph.D., the Projection Oscillator is a by-product of his Projection Bands (see Projection Bands).  The Projection Oscillator is basically a slope-adjusted Stochastic.  Where the Stochastic Oscillator (see Stochastic Oscillator) shows the relationship of the current price to its minimum and maximum prices over a recent time period, the Projection Oscillator shows the same thing, but the minimum and maximum prices are adjusted up/down by the slope of the price's regression line.  This adjustment makes the Projection Oscillator more responsive to short-term price moves than an equi-period Stochastic.
    Put another way, the Projection Oscillator shows where the current price is relative to the Projection bands.  A value of 50 indicates that the current price is exactly in the middle of the bands.  A value of 100 indicates that prices are touching the top band.  A value of 0 indicates that prices are touching the bottom band.

    The Qstick indicator was developed by Tushar Chande.  Qstick provides a way to quantify candlesticks.  The distance between the open and close prices lies at the heart of candlestick charting.  For those unfamiliar with candlestick charting, the body of a candlestick is black if today's close is less than the open; it is white if today's close is greater than the open.  A majority of white candlesticks over a specified range is considered bullish.  Whereas a majority of black candlesticks over a specified range is considered bearish.
    The Qstick indicator is simply a moving average of the difference between open and close prices.

    The Linear Regression method provides several useful outputs for technical analysts, including the r-squared.  R-squared shows the strength of trend.  The more closely prices move in a linear relationship with the passing of time, the stronger the trend. 

    The Relative Strength Index (RSI) is a popular oscillator used by commodity traders.  It was first introduced by J. Welles Wilder in an article in Commodities (now known as Futures) magazine in June, 1978.  Step-by-step instructions on calculating and interpreting the RSI are also provided in Mr. Wilder's book, New Concepts in Technical Trading Systems (see Suggested Reading).
    The name "Relative Strength Index" is slightly misleading as the RSI does not compare the relative strength of two securities, but rather the internal strength of a single security.  A more appropriate name might be "Internal Strength Index."
    The RSI is a fairly simple formula, but is difficult to explain without pages of examples.  The basic formula is:
    RSI =  100  - { 100/ [1+(u/d)] }
    Where:
    U             =             An average of upward price change.
    D             =             An average of downward price change.
    MetaStock Pro prompts you to enter the number of time periods in the averages.

    The Relative Volatility Index (RVI) was developed by Donald Dorsey.  It was originally introduced in the June 1993 issue of Technical Analysis of Stocks and Commodities magazine (TASC).  A revision to the indicator was covered in the September 1995 issue.
    The RVI is used to measure the direction of volatility.  The calculation is identical  to the Relative Strength Index (RSI) (see Relative Strength Index) except that the RVI measures the standard deviation of daily price changes rather than absolute price changes.

    The Renko charting method is thought to have acquired its name from "renga" which is the Japanese word for bricks.  Renko charts were introduced by Steve Nison (a well-known authority on the Candlestick charting method).
    Renko charts are similar to Three Line Break charts except that in a Renko chart, a line (or brick as they are sometimes called) is drawn in the direction of the prior move only if a fixed amount (i.e., the box size) has been exceeded.  The bricks are always equal in size.  For example, in a five unit Renko chart, a 20 point rally is displayed as four equally sized, five unit high Renko bricks.
    To draw Renko bricks, today's close is compared with the high and low of the previous brick (white or black).  When the closing price rises above the top of the previous brick by the box size or more, one or more equal height, white bricks are drawn in the next column.  If the closing price falls below the bottom of the previous brick by the box size or more, one or more equal height, black bricks are drawn in the next column. 
    If the market moves up more than the amount required to draw one brick, but less than the amount required to draw two bricks, only one brick is drawn.  For example, in a two unit Renko chart, if the base price is 100 and the market moves to 103, then one white brick is drawn from the base price of 100 to 102.  The rest of the move--from 102 to 103--is not shown on the Renko chart.  The same rule applies anytime the price does not fall on a box size divisor.
    Indicators calculated on renko charts use all the data in each column and then display the average value of the indicator for that column.

    Standard Deviation is a statistical measurement of volatility.  It is derived by calculating an x
    -time period simple moving average of the data item (i.e., the closing price or an indicator); summing the squares of the difference between the data item and its moving average over each of the preceding x-time periods; dividing this sum by x; and then calculating the square root of this result.
    Standard Error measures how closely prices congregate around a linear regression line.  The closer prices are to the linear regression line, the higher the r-squared value and the stronger the trend. 
    For example, if each day's closing price was equal to that day's regression line value, then the standard error would be zero.  The more variance or "noise" around the regression value, the larger the standard error and the less reliable the trend.

    Sto.chas.tic (st kas'tik) adj. 2. Math. designating a process having an infinite progression of jointly distributed random variables.-- Webster's
    The Stochastic Oscillator compares where a security's price closed relative to its trading range over the last x-time periods.
    For example, to calculate a 10-day %K:  First, find the security's highest high and lowest low over the last 10 days.  For this example, let's assume that during the last 10 days the highest high was 46 and the lowest low was 38--a range of 8 points.  If today's closing price was 41, %K would be calculated as:
    The 0.375 in this example shows that today's close was at the level of 37.5% relative to the security's trading range over the last 10 days.  If today's close was 42, the Stochastic Oscillator would be 0.50.  The 0.50 would show that the security closed today at 50%, or the mid-point, of its 10-day trading range.
    The above example used a %K Slowing Period of 1 day (no slowing).  If you use a Slowing Period of greater than 1 period, you would total the value of the numerators for the number of Slowing Periods, then total the value of the denominators for the number of Slowing Periods, and then perform the division.  For example, to calculate a 10-day %K with 3-period slowing, you would sum the value of the numerators (i.e., today's close minus the lowest low in the last 10 periods) for each of the last three periods, then sum the value of the denominators (i.e., the highest high in the last 10 periods minus the lowest low in the last 10 periods) for each of the last three periods, and finally divide the sum of the numerators by the sum of the denominators.
    A moving average of %K is then calculated using the number of time periods you specified in the %D Periods.  This moving average is called %D.
    Finally, MetaStock Pro multiplies all stochastic values by 100 to change decimal values into percentages for better scaling (e.g., 0.375 is displayed as 37.5%).
    The Stochastic Oscillator always ranges between 0% and 100%.  A reading of 0% shows that the security's close was the lowest price that the security has traded during the preceding x-time periods.  A reading of 100% shows that the security's close was the highest price that the security has traded during the preceding x-time periods.

    The Swing Index seeks to isolate the "real" price of a security by comparing the relationships between the current prices (i.e., open, high, low, and close) and the previous period's prices.
    The Swing Index requires opening prices.
    Although it is beyond the scope of the manual to completely define the Swing Index, the basic formula is shown below.  Step-by-step instructions on calculating the Swing Index are provided in Wilder's

    Theta shows the change in the option's price (in points) due to the effect of time alone.  The longer the time until expiration, the less effect that time has on the price of the option.  However, as the option nears expiration, the effect can be great, particularly on out-of-the-money options.  Theta is also referred to as "time decay."

     originate from Japan and were introduced to the western world by Steve Nison (a well-known authority on the Candlestick charting method).  The Three Line Break charting method gets its name from the default number of line blocks typically used.
    Using the closing price, a new white block is added in a new column if the previous high price is exceeded.  A new black block is drawn if the close makes a new low.  If there is neither a new high or low, nothing is drawn.
    With a default Three Line Break, if a rally is powerful enough to form three consecutive white blocks, then the low of the last three white blocks must be exceeded before a black block is drawn.  If a sell-off is powerful enough to form three consecutive black blocks, then the high of the last three black blocks must be exceeded before a white block is drawn.
    To draw line break blocks, today's close is compared to the high and low of the previous block.  A block is drawn only when today's close exceeds the high or low of the previous block.  If today's close is higher than the top of the previous block, a new white block is drawn in the next column from the prior high to the new high price.  If today's close is lower than the bottom of the previous block, a new black block is drawn in the next column from the prior low to the new low price.  If the close fails to move outside the range of the previous blocks high or low, then nothing is drawn.With the default Three Line Break chart, a downside reversal (i.e., white blocks change to black blocks) occurs when the price moves under the lowest price of the last three consecutive white blocks.  A black reversal block is drawn from the bottom of the highest white block to the new price.  An upside reversal (i.e., black blocks change to white blocks) occurs when the price moves above the highest price of the last three consecutive black blocks.  A white reversal block is drawn from the top of the lowest black block to the new high price.
    Indicators calculated on Three Line Break charts use all the data in each column and then display the average value of the indicator for that column

    The Time Series Forecast indicator is based on the trend of a security's price over a specified time period.  The trend is determined by calculating a linear regression trendline using the "least squares fit" method.  The least squares fit technique fits a trendline to the data in the chart by minimizing the distance between the data points and the linear regression trendline. 
    Any point along the Time Series Forecast is equal to the ending value of a Linear Regression trendline plus its slope.  For example, the ending value of a Linear Regression trendline (plus its slope) that covers 10 days will have the same value as a 10-day Time Series Forecast.  This differs slightly from the Linear Regression indicator (see Linear Regression Indicator) in that the Linear Regression indicator does not add the slope to the ending value of the regression line.  This makes the TSF a bit more responsive to short term price changes.  If you plot the TSF and the Linear Regression indicator side-by-side, you'll notice that the TSF hugs the prices more closely than the Linear Regression indicator.
    Rather than plotting a straight Linear Regression trendline, the Time Series Forecast indicator plots the ending values of multiple Linear Regression trendlines.  The resulting Time Series Forecast indicator is sometimes referred to as a "moving linear regression" study or a "regression oscillator."

    The parameters for Fibonacci Time Zones are shown below.  You can edit the parameters of Fibonacci Time Zones that are already plotted by right-clicking on them and choosing Fibonacci Time Zones Properties from the shortcut menu.
    Date.  This is the date/time on which the dotted "reference" line is drawn.  The remaining time zone lines are drawn to the right of the reference line at the predefined Fibonacci intervals.
    Show Lines in All Windows.  Check this box if you want the time zones to extend vertically across all inner windows within the chart.
    Tirone Levels are a series of horizontal lines that identify support and resistance levels.  They were developed by John Tirone.
    See Drawing a Line Study for more information on drawing line studies.  See Tirone Levels for more information on the Tirone Level parameters.
    The parameters for Tirone Levels are shown below.  You can edit the parameters of Tirone Levels that are already plotted by right-clicking on them and choosing Tirone Levels Properties from the shortcut menu.
    Midpoint or Mean.  Choose the calculation method for the Tirone Levels.  The Midpoint method displays three lines that divide the highest high and lowest low of the range into symmetrical segments.  The Mean method displays five lines ranging between the extreme high and lows and the adjusted mean price.Tirone Levels require actual pricing data to plot.  When it is plotted on kagi, point & figure, three line break, or renko charts, it uses all the data in all the columns.

    The Trade Volume Index (TVI) is designed to calculate on intraday securities with "minutes per bar" set to zero (i.e., a tick chart).  It is calculated by adding each trade's volume to a cumulative total when the price ticks up by a specified amount, and subtracting the trade's volume when the price ticks down by a specified amount.  It's based on the premise that trades taking place at the higher "ask" price are buy transactions (from market marker or specialist to trader)and trades at the lower "bid" price are sell transactions (from trader to market maker or specialist).  The TVI oscillates around zero.  Values above zero indicate net buying pressure, whereas values below zero indicate net selling pressure.
    The TVI is similar to On Balance Volume, except the TVI continues to cumulate the volume (be it on the buy or sell side) if the price is unchanged.  Tick charts (especially of stock prices) will often display trades at the bid or ask price for extended periods without changing (creating a flat spot).  The TVI continues to assign the trade volume during these extended flat periods to either the buy or sell side (depending on its last price change).  The On Balance Volume indicator only assigns volume when price changes occur.  This works well for daily charts but not for tick charts. 
    MetaStock Pro prompts you to enter the "Minimum Tick Value."  The Minimum Tick Value controls when volume switches from the buy side to the sell side.  If the absolute value of the uptick or downtick is less than the Minimum Tick Value, MetaStock Pro will continue to assign the volume to the current side (i.e., buy or sell side).  If the absolute value is greater than the Minimum Tick Value and the price changes direction, MetaStock Pro will switch and begin assigning volume to the opposite side.
    Although the TVI will plot on any chart, it was originally designed to analyze intraday tick charts.  Therefore, you may want to use On Balance Volume for non-tick charts (i.e., 5-minute, hourly, daily, weekly, monthly).  However, the TVI can be used with non-tick data by increasing the Minimum Tick Value.  For example,  you could set the Minimum Tick Value to a large value (e.g., 1, 2, 3, 4 points or more) on a daily stock chart.  This produces a smoothing effect when compared to On Balance Volume.  Volume will cumulate in the direction of the trend until the price reverses by the specified number of points from a previous trough or peak.  When this occurs, volume will then begin to cumulate in the opposite direction.

    MetaStock Pro provides two commands that deal with trendline angles:  Gann Lines (see Gann Fans, Grids, and Lines), and Trendline by Angle (see Trendline By Angle).  The following discussion explains how these commands function and their differences.
    There are basically two ways to quantify the angle of a line drawn on a chart.  The first method is relative to the computer screen (or the piece of paper).  If you draw a line at 45 degrees using a protractor on the screen, the line should rise by one inch for each inch it extends (runs) to the right.  This 45 degree angle also could be expressed as a slope of 1.
    The Trendline by Angle commands work in this manner--relative to the computer screen.  We say it is relative to the computer screen because we are discussing inches, not prices, on the screen.  Regardless of how many days are displayed or what the x- and y-axes of the chart are set to, a 45 degree angle will slope up and to the right at 45 degrees relative to the computer screen.
    A second way to quantify the angle of a line drawn on the chart is relative to the x- and y-axes of the chart itself.
    A 45 degree angle relative to the x- and y-axes would rise one y-axis unit (point) for each x-axis unit (day) that the line extends (runs) to the right.

    1point rise / 1period run

    This is how Gann Lines are drawn:  relative to the x- and y-axes of the chart.  The difference between these two methods, i.e., relative to the screen (inches) or to the axes (points), is substantial.
    Gann Lines specifically ask for the ratio, i.e., the periods (run) and the points (rise).  If you enter 1 x 1, you will get a line that rises one point for each day it travels to the right.  The line may or may not appear to rise at 45 degrees relative to the screen, depending on how many periods you have loaded and how the left scale (y-axis) is set.
    If you want a 1 x 1 Gann Line to appear to rise at 45 degrees relative to the computer screen, you will have to use the X- and Y-Axis Parameters dialog (see X-Axis Properties and Y-Axis Properties ) to manually adjust the x- and y-axis.
    The Trendline by Angle command draws trendlines relative to the computer screen.  Changing the x- and y-axes will have no effect on the angle of the trendline.

    displays the percent rate-of-change of a triple exponentially smoothed moving average of the security's closing price.
    It is the 1-period percent change of an x-period exponential moving average of an x-period exponential moving average of an x-period exponential moving average of the closing price.
    An article on the TRIX indicator appears in Volume One of Technical Analysis of Stocks & Commodities magazine (TASC).  The TRIX indicator presented in the TASC article uses a slightly different method to calculate the exponential moving averages and displays the 1-period change in "points multiplied by 1,000" (whereas MetaStock Pro displays the change as a percentage).

    The Typical Price indicator is calculated by adding the high, low, and closing prices together, and then dividing by three.  The result is the average, or typical price.
    Typical Price = ( high + low + close ) / 3

    Oscillators typically compare a security's (smoothed) price with its price x-periods ago.  Larry Williams notes that the value of this type of oscillator can vary greatly depending on the number of time periods used during the calculation.  Thus, he developed the Ultimate Oscillator that uses weighted sums of three oscillators, each of which uses a different time period.
    The three oscillators are based on Williams' definitions of buying and selling "pressure."

    Vega shows the change in the option price due to an assumed 1% increase in the underlying security's volatility.  Vega shows the dollar amount of gain that should be expected if the volatility goes up one point (all else being equal).

    The Vertical Horizontal Filter (VHF) determines whether prices are in a trending phase or a congestion phase.  The VHF compares the sum of a one period rate-of-change to the range between high and low prices over the specified period.
    The age-old problem for many trading systems is their inability to determine if a trending or trading range market is at hand.  Trend-following indicators such as MACD and moving averages, tend to be whipsawed as markets enter a non-trending congestion phase.  On the other hand, oscillators (which work well during trading range markets) tend to overreact to price pull-backs during trending markets.  The VHF indicator attempts to remedy this by measuring the "trendiness" of a market. 
    MetaStock Pro prompts you to enter the number of periods to use in the calculation.  The default value is 28.

    The Volatility indicator compares the spread between a security's high and low prices.  This is done by first calculating a moving average of the difference between the daily high and low prices and then calculating the percent rate-of-change of that moving average.
    Before calculating the Volatility indicator, you are asked to enter the number of time periods in the moving average and the number of time periods in the R.O.C.  The author of this indicator (Marc Chaikin) recommends 10-periods for both the moving average and the R.O.C.

    The Volume Oscillator displays the difference between two moving averages of a security's volume.  The difference between the averages can be expressed in either points or percentages.

    The Volume Rate-Of-Change (R.O.C.) indicator is calculated by dividing the volume change over the last x-periods by the volume x-periods ago.  The result is the percent by which the volume has changed over the last x-periods.
    If volume is higher today than x-days ago, the R.O.C. will be a positive number.  If volume is lower today then x-days ago, the R.O.C. will be negative.

    Volume is the number of units (i.e., shares or contracts) traded during a specific time period.  The analysis of volume is a basic yet very important element of technical analysis.  Volume helps measure the intensity of price movement.
    Often, the y-axis scale for volume is displayed in multiples of 10s or 100s rather than the actual number (i.e., 500 = 500,000 shares).  If there is a scaling multiple, it will be displayed at the bottom of the y-axis scale. Volume is normally displayed in a histogram line style below the prices (see Moving Inner Windows).
    Some real-time data vendors do not provide volume with every tick.  If this is the case, MetaStock Pro will automatically assign a volume value of "1" for every incoming  tick.  This allows you to at least see the number of "ticks" that have come in during a specified period.  In other words, if the volume on a 1-minute bar is 22, then you know that 22 trades came in during that minute.
    If your real-time data vendor does not supply trade volume with updates, and a symbol is added during a trading session, the first tick will contain the total volume up to that point in the trading session.  MetaStock will then calculate the trade volume for all subsequent ticks.

    The Weighted Close indicator is calculated by multiplying the close by two, adding the high and the low, and dividing by four.  The result is the average price for the day with extra weight given to the closing price.
    Weighted Close =[ (close x 2) + high + low ] /4

    The Wilder's Smoothing indicator was developed by Welles Wilder, best known as the developer of the Directional Movement system (see Directional Movement) and the Relative Strength Index (see Relative Strength Index).
    Wilder used this smoothing indicator as a component of many of his other studies.  It is basically a type of moving average, similar to the "exponential" method in that it retains a decreasingly smaller percentage of all historical data in the series.

    The formula used to calculate Williams' %R is similar to the Stochastic Oscillator:
    Williams' %R is plotted on an upside down scale with 0 at the top and 100 at the bottom.  To show the indicator in this upside down fashion, MetaStock Pro places a minus symbol before the %R values.  You should ignore the minus symbol.

    The Zig Zag indicator filters out changes in the data item (i.e., the security or an indicator) that are less than x percent or points.  It is used primarily to aid in the visual inspection of a chart--punctuating the significant moves.
    www.finanza.com
    info.gif (242 byte)